The Mediated Extension of Self
Brief
For this project we are going to explore how digital technology extends and augments our senses, our bodies and our visions of ourselves. We'll start by creating devices that would allow us to collect data from our immediate surroundings; that would serve as extensions of our bodies and sensory organs. We will organize and distill this data to a meaningful set and explore ways of presenting it that could uncover possible underlying patterns.
Design description
This is an interesting project because it is possible to collect our daily data. I used a microphone sensor to collect the sound of my daily speech in my living room to record the volume of my daily sound. Through the Adafruit data logging platform, I can see the microphone collects a feed every minute. values range from 0-4095. The values vary according to the volume of my voice and eventually present a line graph. I will import the data into HTML+CSS+java to achieve an interesting data visualization.
Design Process
Hardware component:
-Arduino
-ESP32
-Bread Board
-Electret Microphone Amplifier Sensor
-Wires
-Resistance


Display of data records through the Adafruit platform

Data line Chart/ Time Filter

Date Value

Real-time Collection
Software & Iteration
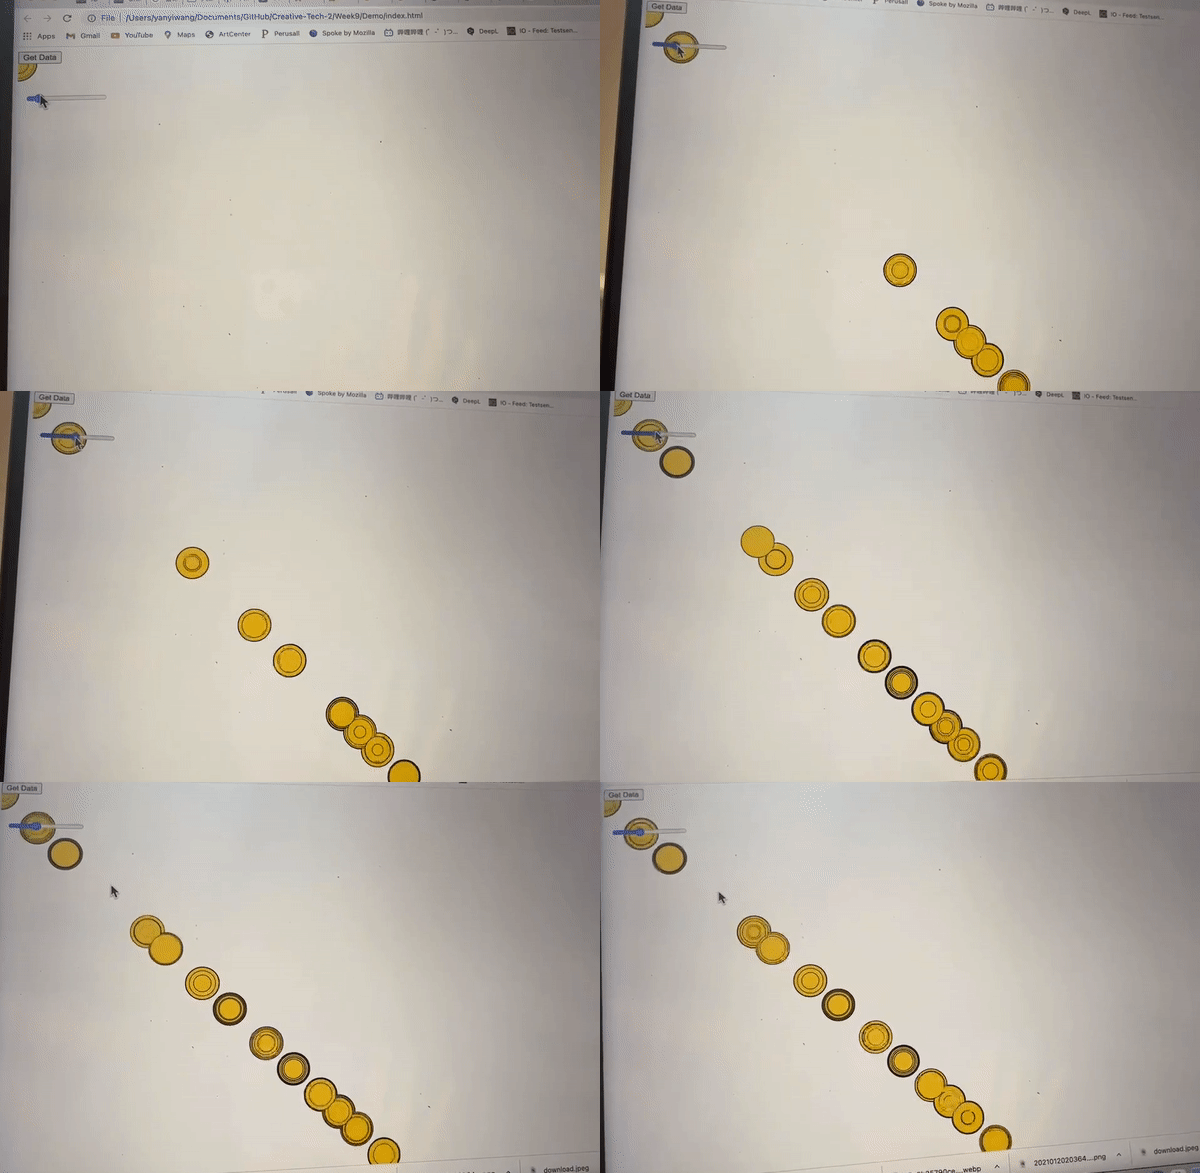
Place the Adafruit data link into the HTML and select the time period of the data you want to display. I recorded a total of five days of data, and in the code, I chose the period from 15:00 to 23:00 on March 13.


1.0
Each data is presented in a circle, and the color changes randomly as the Slidbar slides to the right to get more data. The total number of data I set is 100.


2.0
In the second version, I also set data to be represented by a circle. The total number of data is 100. The difference is that I make the data appear on the screen from the beginning and keep it constant. When the user moves the slide bar to the right, the circle color changes randomly to render each circle. The whole visual will appear in a cyberpunk style.


3.0
In version 3, I adjusted the number of data from 100 to 600 in order to show more data in this eight-hour period. Under the guidance of my mentor, I used a map() to show the circles evenly distributed on the page. As the slide bar slides to the right, the circle changes randomly and flashes a different color.
